
The short answer
Sometimes — and the deciding variables are the soiling rate on your site, what a kilowatt-hour is worth to you, and the installed price you are quoted per kWp, more than plant size alone. For a ground-mounted plant selling power at about $0.035/kWh, a fully automated cleaning system breaks even over 10 years at roughly $22–34 per kWp under moderate-to-high soiling. Peer-reviewed literature puts the cost of such systems at about $12–42 per kWp. Those ranges overlap, so payback runs from about 1.2 years (very high soiling, low-end price) to no payback at all (low soiling, high-end price).
Plant size matters mainly through the installed price per kWp, because a robot deployment has costs that do not shrink with the plant. Section 4 therefore turns plant size into a budget: the most a site of that size can spend and still break even.
Scope and disclosure. This article covers the purchase decision for cleaning robots. Cleaning frequency is covered in How Often Should You Clean Solar Panels?, method selection in Dry vs Wet Solar Panel Cleaning, and water quality in Can You Clean Solar Panels With Tap Water?. WaterSprayElephant manufactures PV cleaning robots, so the analysis below is built from third-party sources and an open formula (Section 2) that you can check without relying on us. It contains no WaterSprayElephant prices.
1. Why published payback figures disagree
Search for cleaning-robot payback and the figures run from under a year to several years. The spread is less a disagreement about robots than a difference in what each source discloses.
| Source | What it reports | What it discloses |
|---|---|---|
| Robot vendor ROI page (Solaris Hydrobotics) | Payback of 12–24 months for utility-scale, 18–36 months for commercial and industrial, and 3–4 years for residential; one 500 kW rooftop case at 1.8 years. | Robot cost, power price and site soiling rates are not stated. |
| Robot vendor illustrative 25 MW comparison (Taypro) | In its own illustration, the robot fleet’s annual cleaning O&M is higher than manual wet cleaning; the case rests on water saved and energy recovered. It notes that small fixed-tilt sites under 5 MW with mild soiling and cheap water may not clear robot capex. | Tariff stated; robot capex and soiling loss in percent not stated; labelled “illustrative only”. |
| Peer-reviewed assessment (Ilse et al., Joule, 2019) | Computes the maximum investment that gives a positive net present value over 10 years at a 5% discount rate, then compares it with reported robot costs. For an 80–100% cut in soiling rate, the average allowed investment is about $13–41 per kWp, against reported fully automated system costs of about $12–42 per kWp. | Method, equations and input assumptions published; utility-scale plants with an assumed power price of about 3 cents per kWh. |
Read together: at the average utility-scale conditions in the peer-reviewed paper, what a robot can justify and what robots cost land in the same place. That is a break-even, not a 12–36 month payback. A short payback is possible, but it describes a specific site where soiling is heavier, power is worth more, or the price sits below the literature range — and a claim like that needs that site’s numbers.
Currency and unit conversions. Ilse et al. and the European study cited below report cleaning and robot costs in euros per m² of module area (or per kW). We convert at an assumed 1.10 USD per EUR and 21.4% module efficiency (0.214 kWp/m², the efficiency used in the European study) and show only dollars. The conversion is ours, not the papers’, and the 2019 cost figures predate recent changes in hardware and labour costs.
2. The payback formula and where each input comes from
The calculation has three parts. Every input is either sourced or flagged as our assumption.
- Value at stake — what soiling and cleaning cost per kWp per year under your best manual schedule. Soiling loss = Y × p × SR × (n + 1) / 2, where Y is specific yield (kWh/kWp·yr), p is the value of a kWh, SR is the soiling rate (fraction of output lost per day) and n is days between cleanings. Cleaning spend = u × 365 / n, where u is the cost of one cleaning per kWp. The cost-minimising interval is n = √(730 × u / (Y × p × SR)), the form derived by Ilse et al. We floor it at one cleaning per year.
- Value recovered — value at stake minus the soiling that remains when a robot passes daily, which is one day of accumulation (1 × SR). The daily pass reflects the literature figure of more than 95% soiling-rate reduction for fully automated systems.
- Payback and break-even — simple payback = C / (B − r × C), where C is the installed quote per kWp, B is value recovered per year and r is annual running cost as a fraction of C. The break-even quote over 10 years at 5% is 8.11 × B / (1 + 8.11 × r). By construction, a simple payback of 8.1 years is exactly the break-even point.
| Input | Value used | Source or basis |
|---|---|---|
| Specific yield Y | 1,400 kWh/kWp·yr | NREL O&M cost-model example (10 MW tracking plant, Denver). Adjust to your site. |
| Power value p, ground-mount | $0.035/kWh | LBNL Utility-Scale Solar, 2024 Edition: newly signed PPAs average $35/MWh levelized (2023 dollars). |
| Power value p, rooftop | $0.145/kWh | EIA Electric Power Monthly: US commercial average retail price 14.53 ¢/kWh, July 2026. Assumes every kWh offsets retail power; exported kWh earn less. |
| Cost per manual cleaning u, ground-mount | $1.0 per kWp | IEA PVPS Task 13 modelling example (0.2 euro per m² per cleaning, about $1.03 per kWp when converted). The European study reports about $0.3–4.7 per kWp across countries. NREL’s 10 MW model example carries $41,410 per year for cleaning and vegetation management together, about $4.1 per kW. |
| Cost per manual cleaning u, rooftop | $4.0 per kWp | About four times the ground-mount figure. Ilse et al. report rooftop cleaning at 3–8 times the cost of ground-mounted PV. |
| Soiling rate SR | 0.01 / 0.04 / 0.10 / 0.30 % per day (about 0.3 / 1.2 / 3.0 / 9.0 % per month) | IEA PVPS Task 13 tabulates measured US monthly rates from 0% (natural desert, winter) to 11.5% (dry agricultural, autumn). The four levels span that range; they are scenarios, not regional claims. |
| Robot installed cost C | $12–42 per kWp | Ilse et al., Table 2: fully automated cleaning systems, converted from euros per m². A 2019 literature range, not a quote. |
| Running cost r | 5% of C per year | Our assumption, not a published figure. Covers batteries, brushes, service and supervision. Section 3 shows the sensitivity. |
| Evaluation period and discount rate | 10 years, 5% | Ilse et al. |
Two limits of the model. It treats soiling as accumulating linearly between cleanings, which ignores rain; where rain cleans well, the real value at stake is lower. A European study of measured soiling found annual loss averaging 0.9% across Europe if rain is assumed to clean perfectly, and 5.3% if rain removes only 10% of accumulated soiling. A range that wide is why measuring your own site matters more than any table here.
3. Ground-mounted plants: break-even quotes and payback
Table 1 applies the formula to a ground-mounted plant with power worth $0.035/kWh and a manual cleaning cost of $1 per kWp per pass, at four soiling rates. The last two columns show payback if the installed price is at the low ($12/kWp) or high ($42/kWp) end of the literature range.
| Soiling level | Soiling + cleaning cost at stake ($/kWp·yr) | Break-even quote, 10 years at 5% ($/kWp) | Quote for a 5-year payback ($/kWp) | Payback at $12/kWp | Payback at $42/kWp |
|---|---|---|---|---|---|
| Low: 0.01% per day (0.3% per month); best manual schedule 1.0 cleanings per year (floor) | $1.90 | $11 | $8 | 9.3 years | No payback |
| Moderate: 0.04% per day (1.2% per month); best manual schedule 1.9 cleanings per year | $3.79 | $22 | $15 | 3.8 years | >20 years |
| High: 0.10% per day (3.0% per month); best manual schedule 3.0 cleanings per year | $6.01 | $34 | $24 | 2.2 years | 10.9 years |
| Very high: 0.30% per day (9.0% per month); best manual schedule 5.2 cleanings per year | $10.43 | $59 | $41 | 1.2 years | 5.1 years |
Under the best manual schedule, mean annual soiling loss in these four cases is 1.8%, 3.9%, 6.2% and 10.7%. With daily robot passes it stays near one day of accumulation, 0.01–0.30%. Modelled results, not measurements.
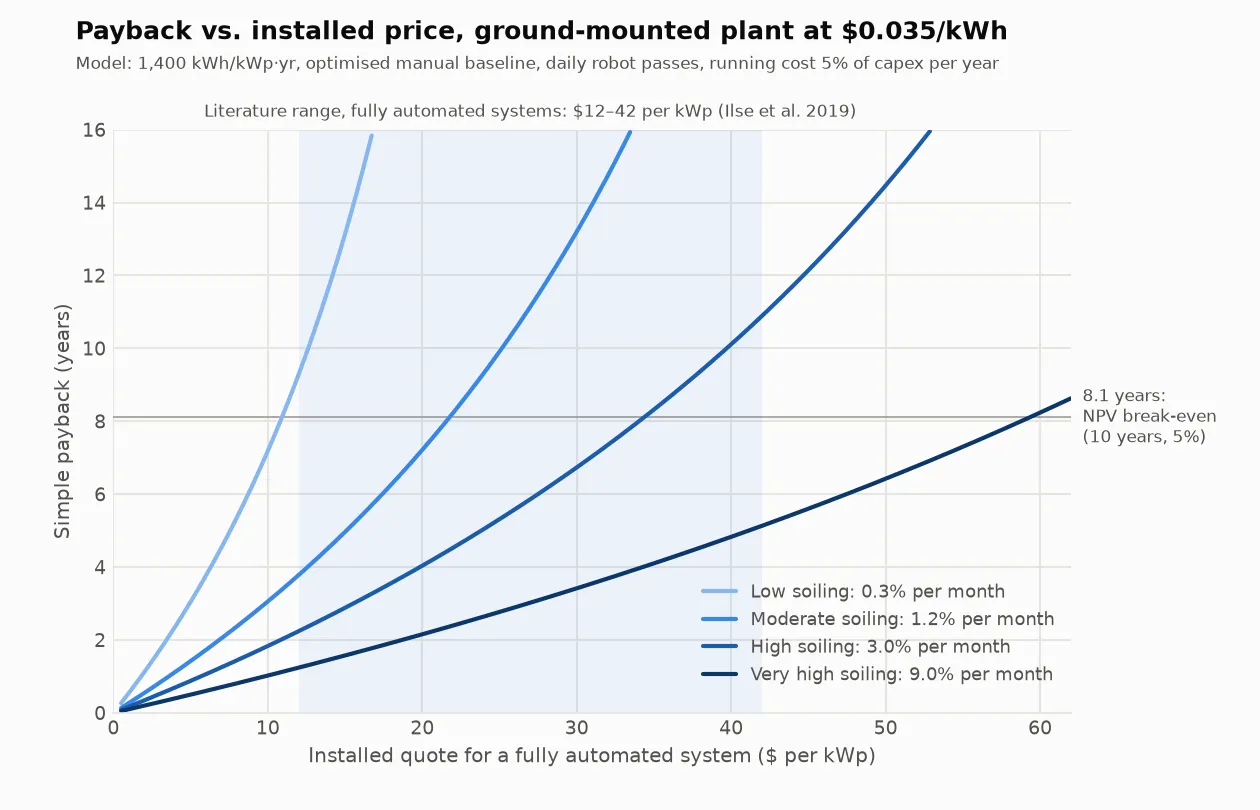
- Very high soiling (9.0% per month): 1.2 years at the low end of the price range and 5.1 years at the high end. This is the only row where payback stays near or under five years across the whole range.
- High soiling (3.0% per month): 2.2 years at $12/kWp and 10.9 years at $42/kWp. A 5-year payback needs a quote of about $24/kWp or less.
- Moderate soiling (1.2% per month): 3.8 years at $12/kWp, but >20 years at $42/kWp. A 5-year payback needs about $15/kWp or less.
- Low soiling (0.3% per month): the best manual schedule is one cleaning a year and the value at stake is $1.90/kWp·yr. Break-even is about $11/kWp, below the low end of the literature range, so no price in that range pays back within 8.1 years.
Running cost moves these results more than most buyers expect. At the high soiling rate, raising running cost from 0% to 5% to 10% of the quote per year moves the break-even quote from $48 to $34 to $27 per kWp, and payback at $42/kWp from 7.1 years to 10.9 years to >20 years. The 5% figure is our assumption; replace it with the running cost stated in the quote you receive.
As a cross-check, the model’s break-even quotes for moderate to high soiling, $22–34 per kWp, fall inside the $13–41 per kWp that Ilse et al. report as the average allowed investment for an 80–100% soiling-rate reduction.
4. Plant size: what budget does your site support?
Per kWp, the economics above do not depend on plant size. What size changes is the installed price per kWp. A deployment has costs that do not shrink with the plant: at least one robot or one row system, commissioning, training and, for fixed-row systems, a row-layout and end-structure assessment. For a small plant the useful question is therefore not a payback figure but the total budget it can support. Table 2 multiplies the break-even quotes by plant size at moderate and high soiling.
| Plant | Soiling + cleaning cost at stake per year (moderate soiling) | Break-even budget, moderate soiling (1.2% per month) | Break-even budget, high soiling (3.0% per month) |
|---|---|---|---|
| Residential rooftop, 8 kWp | $120 | $710 | $1,100 |
| Small commercial rooftop, 250 kWp | $3,900 | $22,000 | $35,000 |
| Large commercial, 2 MWp, retail-priced power | $31,000 | $180,000 | $280,000 |
| Ground-mount, 2 MWp, PPA-priced power | $7,600 | $44,000 | $69,000 |
| Utility-scale, 50 MWp, PPA-priced power | $190,000 | $1,100,000 | $1,700,000 |
How to read Table 2. Compare it with an all-in quote: hardware, commissioning, training and site works, plus 10 years of running cost at the 5% assumption. If the quote exceeds the budget, the purchase loses money over 10 years at a 5% discount rate in that scenario. Rooftop rows use the retail power value ($0.145/kWh) and a cleaning cost four times the ground-mount figure; ground-mount rows use the PPA-level value. Figures are rounded to two significant digits. A contractor spreading one machine across many customers is a different calculation: the machine earns service revenue instead of recovering one site’s energy.
Two readings follow. For an 8 kWp home system the value at stake is about $120–200 per year, and any all-in robot quote above roughly $710–1,100 loses money over 10 years in this model. At 250 kWp the budget is about $22,000–35,000; whether one deployment fits inside that depends on the quote. From 2 MWp upward the budget grows in proportion to plant size, fixed deployment costs matter less per kWp, and the soiling rate and the value of a kWh take over as the deciding inputs.
5. Which robot type matches which economics
The daily-pass assumption in Table 1 applies to fully automated systems. Remote-controlled crawler robots change the economics differently, and each class needs its own test.
| Equipment class | Published specifications | Where the money comes from | Savings ceiling |
|---|---|---|---|
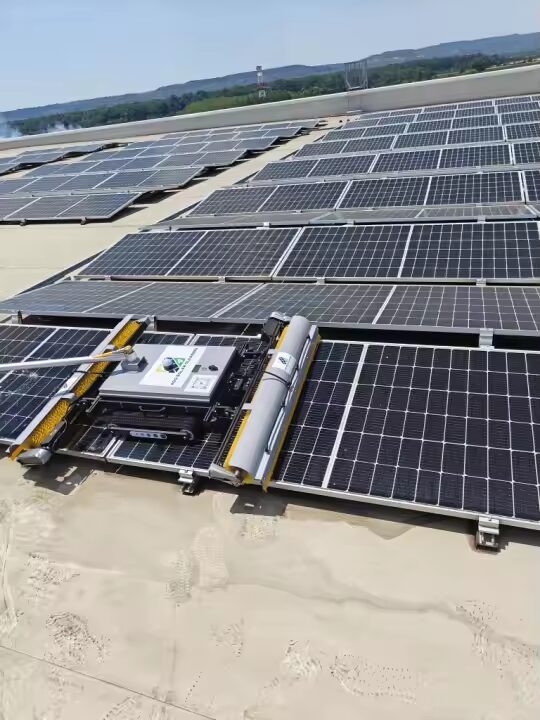
| Remote-controlled crawler robots: R1 (battery) and R2 (mains) | R1: wet or dry cleaning, working angle up to 20°, module-gap crossing up to 20 cm, published runtime of 6–8 hours on dual lithium batteries. R2: mains power (stable site power of 100–250 V), crossing up to 25 cm, working angle up to 20°. | A lower cost per pass, and more passes with the same crew. The IEA PVPS report classes portable robots that are moved from row to row as semi-automatic, so a crew is still part of each pass. | Your current manual cleaning spend plus the energy value of any extra passes. On a ground-mount plant, cleaning spend under the best manual schedule is about $1.9–5.2 per kWp per year across the moderate-to-very-high rows of Table 1, roughly half of the cost at stake. |
| Fixed-row automated systems: R20 (hanging autonomous robot) and R20A (shuttle that moves robots between rows) | R20: scheduled cleaning through cloud, mobile-app or timer control; designed for uniform fixed ground-mounted rows, with row length, gradient and module dislocation inside engineered limits; a row-layout and end-structure assessment is required before quotation. R20A: moves compatible hanging robots between engineered rows, reducing the need for one robot per row, as part of an integrated cleaning-and-transfer project. | Scheduled passes without a crew — the mechanism behind the more-than-95% soiling-rate reduction the literature attributes to fully automated systems. This is the class Table 1 models. | Value at stake (Table 1) minus residual soiling and running cost. |
We make these products, so read this section as a summary of published specifications, not as an endorsement. We have not published prices or measured payback figures for them in this article; run the formula against a project quote. Both crawler robots also run wet or dry, which ties the economics back to soil type and water cost — see the method comparison linked at the top of this article.
6. When a robot is the wrong purchase
- Your best manual schedule is about one cleaning a year. That is the low-soiling row of Table 1: $1.90 per kWp per year at stake on a ground-mount plant, below what any price in the literature range can recover.
- Rain does most of your cleaning. The European soiling study’s 0.9% to 5.3% range depends entirely on how well rain cleans. Measure before you buy; do not borrow a regional average.
- The array is outside the robot’s published limits. Our crawler robots are designed for working angles of about 15–20°; R1 crosses module gaps up to 20 cm and R2 up to 25 cm; fixed-row systems need uniform rows within engineered limits. A robot that cannot traverse your array has no payback.
- Cleaning labour is already cheap. The European study reports per-cleaning costs from about $0.3 to $4.7 per kWp across countries. At the low end, there is little spend for a robot to avoid.
- The plant is small and the quote is not. Compare the quote with the budget in Table 2 before requesting a site visit.
Our Romania rooftop project documents a double-head cleaning robot on a commercial rooftop. It is a project narrative rather than a payback calculation, so it is not an input to the model here.
7. Run your own numbers
- Measure your soiling rate. Four to eight weeks of readings in a dry period give a rate in % per day. An optical soiling sensor such as our A60 PV Dust Measuring Instrument reports PV-glass cleanliness (soiling ratio), not energy loss, so convert the rate to energy with your own irradiance-normalised data; the validation methods are in section 6 of the cleaning-frequency guide.
- Find your cost per cleaning per kWp from your O&M provider’s invoices: total cost of a pass divided by plant capacity in kWp.
- Compute the value at stake with the formulas in Section 2. They are short enough for a spreadsheet.
- Request all-in quotes with hardware, commissioning, training and running cost listed separately.
- Test the result against the 8.1-year threshold, then re-run it with the soiling rate 50% lower and the running cost five points higher. If the answer survives both, it is robust.
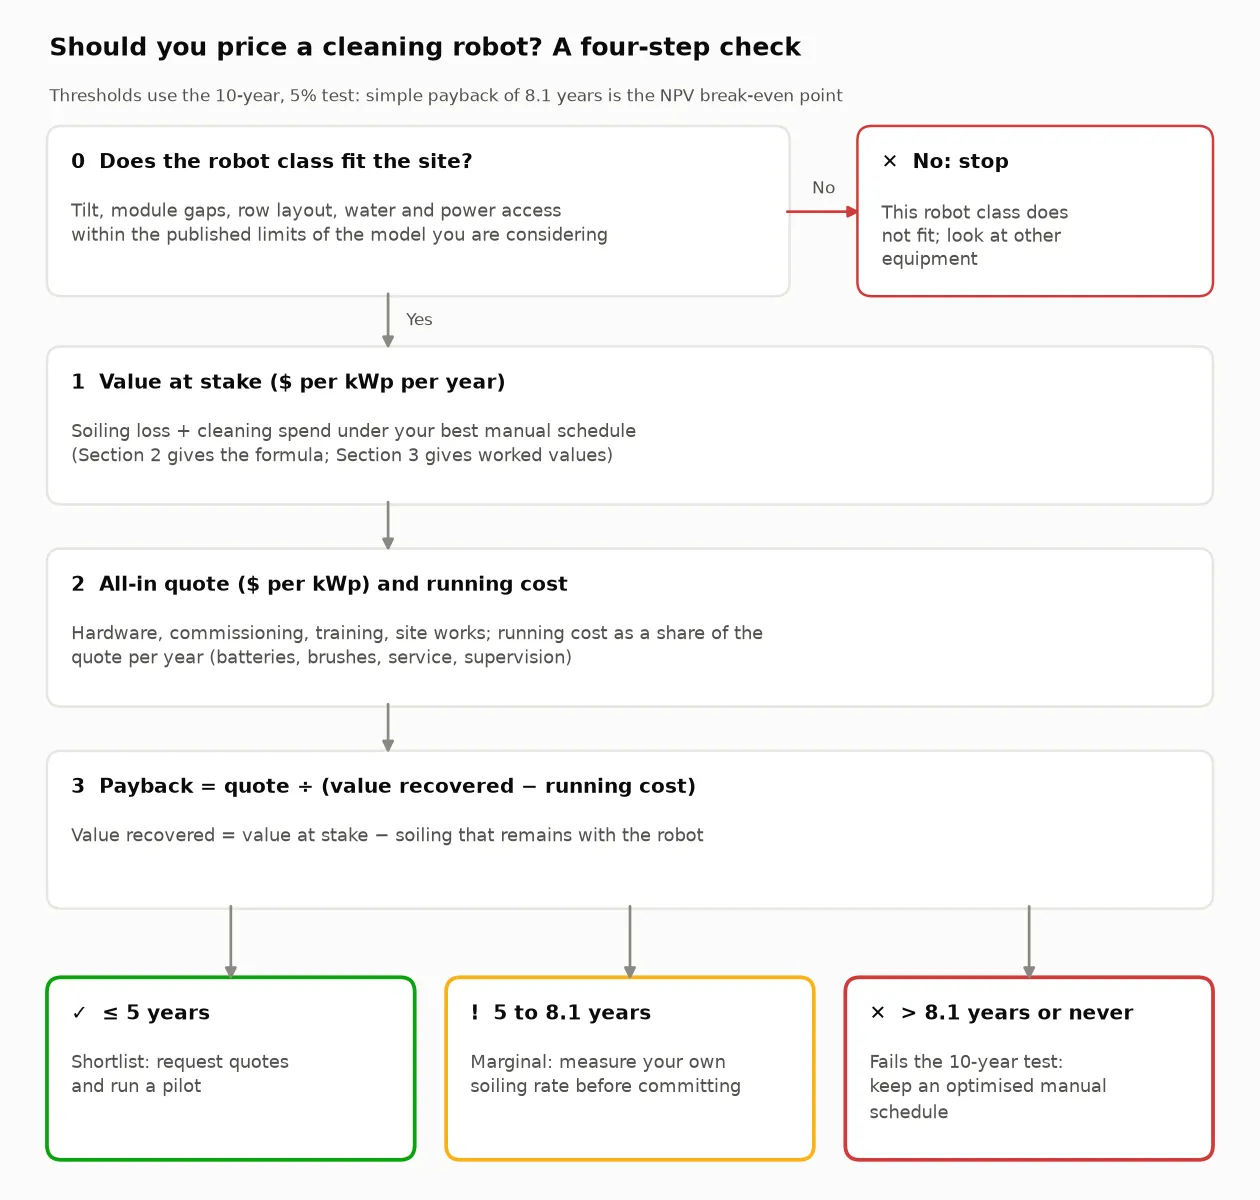
After any purchase, verify the result with a same-day before-and-after reading rather than comparing two different days, because weather alone can swing daily output enough to hide a cleaning gain.
Frequently asked questions
Are solar panel cleaning robots worth it?
It depends on three numbers: your soiling rate, the value of a kWh, and the installed quote per kWp. For a ground-mounted plant at $0.035/kWh, fully automated systems break even over 10 years at about $22–34 per kWp under moderate-to-high soiling, inside the $12–42 per kWp literature range. They do not break even under low soiling, and they do across the whole range under very high soiling (break-even about $59 per kWp).
How long is the payback period for a solar panel cleaning robot?
In the model for a ground-mounted plant, payback runs 1.2 years to 5.1 years at very high soiling, 2.2 years to 10.9 years at high soiling, 3.8 years to >20 years at moderate soiling, and 9.3 years to no payback at low soiling, from the low to the high end of the literature price range. Robot vendors publish 12–36 months for utility and commercial sites without disclosing robot cost, power price or soiling rate.
How much does a solar panel cleaning robot cost?
A 2019 peer-reviewed assessment reports fully automated cleaning systems at about $12–42 per kWp of module capacity (converted from euros per m²). We do not publish WaterSprayElephant prices in this article; the R20 product page states that a row-layout and end-structure assessment is required before quotation.
Is a cleaning robot worth it for a home solar system?
In this model, the value at stake for an 8 kWp rooftop is about $120–200 per year at moderate-to-high soiling, and the 10-year break-even budget is roughly $710–1,100. An all-in quote above that loses money, so periodic manual cleaning is the option a robot has to beat.
Do cleaning robots recover more energy than manual cleaning?
In the model, daily robot passes hold average soiling loss near one day of accumulation (0.01–0.30%), against 1.8–10.7% for the best manual schedule. Real fleets miss days to weather, faults and battery cycles, so treat the robot figure as an upper bound.
Does a cleaning robot pay back faster in a desert?
Higher soiling raises the value at stake and shortens payback: at $42/kWp, payback in Table 1 falls from 10.9 years at high soiling to 5.1 years at very high soiling. Dust type, dew and wind also change how well a given robot performs, so measure the site rather than assuming the region.
What running costs should I include?
Batteries or mains supply, brushes, service visits, spare parts and supervision. The model assumes 5% of the quote per year, which is our assumption. At 10% per year, payback at $42/kWp under high soiling goes from 10.9 years to >20 years.
Sources
- Ilse et al. — Techno-Economic Assessment of Soiling Losses and Mitigation Strategies for Solar Power Generation, Joule 3 (2019) (soiling-loss model, cost-minimising cleaning interval, 10-year / 5% allowed-investment method, fully automated cleaning cost range, rooftop cleaning cost multiple)
- Fernández Solas et al. — Photovoltaic soiling loss in Europe: Geographical distribution and cleaning recommendations, Renewable Energy 239 (2025) (European annual soiling loss with and without rain cleaning, per-cleaning cost range, 21.4% module efficiency)
- IEA PVPS Task 13 — Soiling Losses: Impact on the Performance of Photovoltaic Power Plants (T13-21:2022) (US monthly soiling rates, per-cleaning cost example, semi-automatic robot classification, annual manual cleaning recommendation)
- NREL — Model of Operation-and-Maintenance Costs for Photovoltaic Systems (NREL/TP-5C00-74840, 2020) (specific yield example)
- Berkeley Lab — Utility-Scale Solar, 2024 Edition (average levelized PPA price)
- US EIA — Electric Power Monthly, Table 5.6.A (commercial average retail price, July 2026)
- Solaris Hydrobotics — The ROI of Autonomous Solar Panel Cleaning (vendor-published payback ranges)
- Taypro — Benefits of Cleaning Robots on Indian Utility Solar Plants (vendor illustrative 25 MW comparison)